ForeFlight introduces crowdsourced turbulence reports
iPad Pilot News

Sentry and Sentry Plus models include an AHRS that can be used to record turbulence.
Electronic flight bag apps like ForeFlight, when paired with portable weather receivers like Sentry, make it much easier for pilots to avoid in-flight weather hazards. That includes the big three threats (thunderstorms, in-flight icing, and low IFR conditions), but right after those critical concerns comes passenger comfort—and that usually means turbulence. Even if it’s not dangerous, constant bumps can ruin an otherwise pleasant flight. Now ForeFlight has found a creative way to give pilots more detailed and timely information.
Version 16.4 adds an optional Reported Turbulence layer on the Maps page, but it’s not your typical FAA weather forecast. Instead, it presents live, automated reports from other pilots who are flying with a Sentry. Using the built-in attitude sensors in these devices, ForeFlight automatically records G-load, then downloads anonymized data and uploads it when the iPad is connected to the internet. The result is essentially crowdsourced ride reports. This is a major breakthrough, but there are some important details to understand, so read on before you update the app.
Two major improvements
Graphical turbulence forecasts and pilot reports (PIREPs) are essential products for preflight planning, but ForeFlight’s novel approach offers two key benefits over traditional turbulence products.
1. There are a lot more reports. Because Sentry is automatically recording attitude data, pilots don’t have to remember to make a report and air traffic control doesn’t have to remember to send the report through the system. In fact, ForeFlight estimates their Reported Turbulence layer offers 50 times more turbulence reports than manual PIREPs. That can make a dramatic difference, especially for piston pilots who want to know about low altitude turbulence.
Here’s an example of PIREPs on a fairly calm afternoon—you’ll notice very few turbulence PIREPs below 10,000 feet:

And here is ForeFlight’s Reported Turbulence layer showing reports just at 4000 feet—a significant increase in data. You can see airplanes flying long cross-countries, as they tend to draw straight lines across the map.

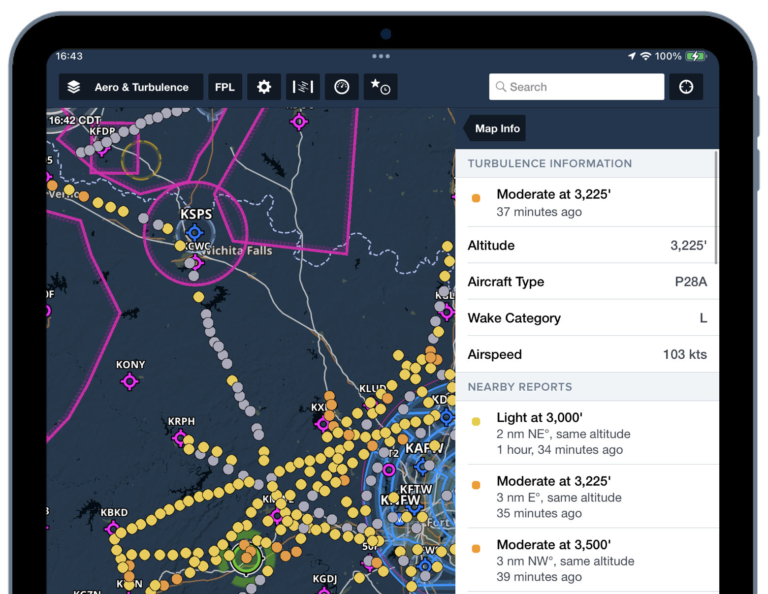
2. The reports are objective. Turbulence is notoriously subjective: one pilot’s moderate is another pilot’s light. ForeFlight is trying to normalize those reports by using actual sensor data plus some sophisticated algorithms (the team behind this new product explained how they calculate it and suffice it to say, it’s complicated). Each report is presented as a color-coded dot on a map, from gray to red:

Like a METAR, you can tap on a dot for more information, including age, airplane type, and speed (an important factor in determining how applicable a report is for your airplane).

Testing it
That’s the theory; how does it work? In our limited testing so far, Reported Turbulence looks like a major addition to a pilot’s toolkit. In particular, it’s great for GA pilots flying unpressurized airplanes, since the majority of PIREPs usually come from airline pilots in the flight levels. We can think of at least a dozen trips over the last year where having some meaningful reports of turbulence—good or bad—would have helped us make a better preflight decision. That’s why the altitude slider on the right side of the Maps page is so important. Slide it up and down to view reports at different altitudes and evaluate different options.
Even better, use the Profile view, accessed from the FPL menu at the top of the page. This makes it much easier to visualize where the bumps are, both in terms of your route and your planned altitude.

The other major benefit we’ve seen in testing is that you find many more reports of smooth rides. Often, pilots only submit a PIREP when they encounter turbulence. That’s understandable, but a negative report can be just as valuable, and Reported Turbulence shows a lot of gray dots. Note the screenshot above, which shows a smooth flight going over the Appalachian Mountains at 10,000 feet. That’s a major confidence boost for a pilot contemplating such a route with relatively strong westerly winds.
There are a few weak points, though. First, ForeFlight’s layer seems to overstate the prevalence of moderate and severe turbulence just a bit. The dots show the worst turbulence over a two-minute interval, not the average, so this is partially intentional—ForeFlight is offering a worst case—but in general we think it’s pessimistic. Here’s an example, with dozens of reports of moderate turbulence at 3,000 feet and below:

And yet the overall weather was great on this day: no clouds, relatively light winds (no gusts) and no significant weather of any kind. Sure, there were a few afternoon thermals but we found it to be a typical-to-good day for flying in a light airplane. Did it meet the technical definition of moderate? Maybe, but the turbulence picture above can make it seem worse than it is.

One thing is for sure, though: if you see no turbulence, you can be confident in that report. That matters.
Also remember that these turbulence reports can only make their way onto your iPad when the pilot flying with a Sentry connects to WiFi or LTE. That might be immediately for turbine airplanes equipped with in-flight WiFi, but if it’s after landing the delay could be significant. Still, ForeFlight says nearly half the turbulence reports are live within an hour.
That’s impressive but it means you need to watch the time stamps on these turbulence reports by tapping on relevant dots. ForeFlight will show data up to six hours ago, which is forever when it comes to turbulence. However, the app is smart in how it displays the reports: as you zoom out, the map declutters and shows newer dots at larger scales.

How to get it
One other difference with this product compared to traditional radar and METAR layers is that not everyone will see it. You must have the right subscription before the Reported Turbulence layer will appear, and pilots who own a Sentry receive a $50 discount.

For hardware, you must register a Sentry or Sentry Plus to your ForeFlight account to get the discount. To do that, visit plan.foreflight.com and click on your name to access account information. From there you can register your Sentry by typing in your device’s serial number.

Then make sure you have the right subscription, as Reported Turbulence is available as two subscription add-ons. Low covers altitudes up to 14,000 feet and is included with Pro Plus and Performance Plus subscriptions ($50/year but with a $50 discount), so if you register your Sentry there is no fee. For pilots of turbocharged and turbine airplanes, you’ll want to add the All package, which includes altitudes into the flight levels and costs $50/year after the discount. If you don’t fly with a Sentry or Sentry Plus but have a Pro or Performance subscription, you can add Reported Turbulence at foreflight.com/buy for $50/year or $100/year. Also note that you must be flying with an active ADS-B Out transponder on your airplane, but this new feature does not require a Sentry firmware update.
ForeFlight version 16.4 also adds some other new features, including: lowest tilt radar as a map layer, a new landing factor selector option in runway analysis, and a printable TOLD card. More details from ForeFlight.
The post ForeFlight introduces crowdsourced turbulence reports first appeared on iPad Pilot News.
The post ForeFlight introduces crowdsourced turbulence reports appeared first on iPad Pilot News.
Source: Ipad appsForeFlight introduces crowdsourced turbulence reports