SkewTLogPro releases version 3.0—upgrade your weather briefing today
iPad Pilot News
It seems like there are two types of pilots: those who have never heard of Skew-T log (p) charts and true believers who know they are the source of all truth and knowledge about weather. The second group is overstating things just a bit, but the first group is definitely missing out on some helpful weather information. With a little training—and the affordable version 3.0 of the SkewTLogPro app—it’s easy to integrate Skew-T diagrams into your normal preflight routine. Here’s how to get started.
First, a quick summary of what they are and how to use them. A Skew-T log (p) chart essentially shows a three-dimensional view of the atmosphere above a particular location, including temperature, dew point, and wind. These are typically observations from weather balloons, which are released twice a day from nearly 100 locations in the US, which are then fed into sophisticated weather models to build forecasts. That means you can view Skew-T charts for the past, present, and future.
These charts are available free online from NOAA, but the site is not the easiest to use and there is enough jargon to scare off all but the most dedicated pilot. It’s also not available in flight, when you don’t have an internet connection. The SkewTLogPro app is a faster and easier way to access the same information, and allows you to save charts for later review.
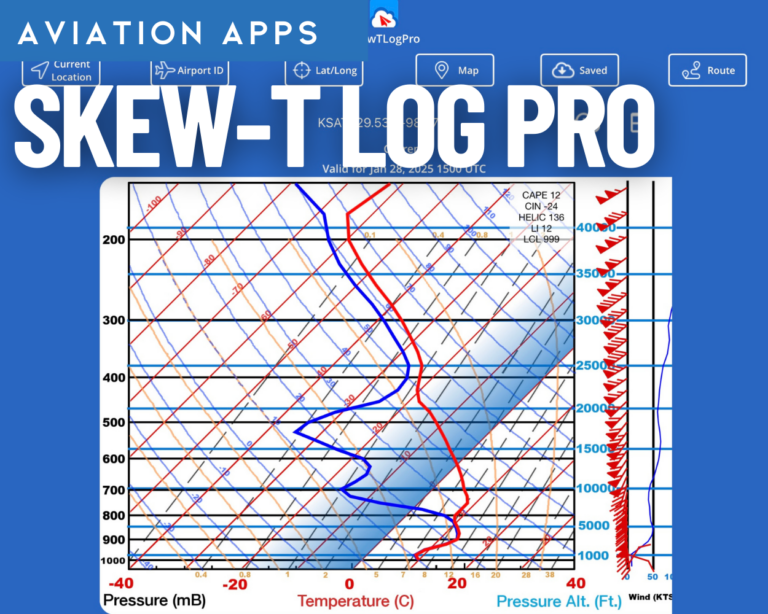
The easiest way to view a Skew-T chart in the app is to tap the Airport ID button and enter your desired airport. There may not be a sounding directly at that airport, but the app will bring up the closest one and show underneath how far away it is from what you entered. There’s also an option to enter lat/long coordinates or use your current location.
In the example below, we chose the San Antonio airport. By default, the app will show the chart for the current time. In this case, note that the temperature line (red) and the dew point line (blue) converge at essentially ground level, and remain together until about 6,000 feet. That suggests the air is saturated and you can expect clouds from the surface to 6,000 feet. The good news is that it looks clear above (note how quickly the dew point diverges) and there shouldn’t be any ice in the clouds (the two lines are to the right of the 0-degree temperature line, which is skewed to the right at 45 degrees). To the right you can see the winds aloft: about ten knots down low, picking up to more than 50 knots out of the southwest at 10,000 feet and above. Comparing this information to the current METAR for the area confirms this data, with low ceilings and light winds.

There’s a lot of information on that screen, but with a little practice, it’s easy to glean a lot of information from one glance. How thick are the clouds? Can I get on top today? Is there ice on climb out? Is there wind shear at a certain altitude? What’s the best cruising altitude? All of these questions can be answered (at least in part) by the Skew-T diagram.
Fortunately, you can use this as a forecast tool as well. Swipe right on the current chart to see hourly updates. In this case we have moved out five hours, to 2000 UTC. The temp/dew point lines at low altitude on the Skew-T suggest continue to converge suggesting continued low ceilings as confirmed by the TAF.

Now that you know how to use a Skew-T diagram, take some time to explore the SkewTLogPro app. For more general browsing, tap the Map button at the right side of the screen. You can pan around and then long press on a location to see the chart for that location.

There’s also a route option, which is a great tool for pilots planning a trip. Tap Route at the top right, then enter your Departure and Destination airports. You can also enter a proposed departure and arrival time underneath the airports, and an interval for charts along the route. Tap Chart to see a complete trip in sequence: you’ll start at your departure airport at your ETD, then swipe to see charts en route, adjusted for time. In the second screenshot below you’ll notice a map option, which shows your departure airport in blue, your destination in red, and your current chart location in light blue.


You can save a chart for offline access (useful in flight) by tapping the cloud icon at the top right corner of the chart you want to save. This is then accessible from the Saved button on the right side of the screen.

The settings menu doesn’t need much attention unless you’re a weather expert, but it does offer the option to change how many hours of Skew-T diagrams to display by default.

SkewTLogPro is available as an annual subscription for $12.99, and works on both iPhone and iPad. This isn’t a flashy app, but it’s simple and it works well. For anyone who wants to take their weather briefing to the next level (especially IFR pilots), it’s definitely worth the money.
To learn a whole lot more about skew-t log-p diagrams, we recommend training from Scott Dennstaedt, avweathertraining.com.
The post SkewTLogPro releases version 3.0—upgrade your weather briefing today first appeared on iPad Pilot News.
The post SkewTLogPro releases version 3.0—upgrade your weather briefing today appeared first on iPad Pilot News.
Source: Ipad appsSkewTLogPro releases version 3.0—upgrade your weather briefing today