Garmin has spent the last few years working hard to integrate its Pilot app with its industry-dominating line of panel avionics, from simple retrofit GPSs to full glass cockpits. This allows pilots to push a flight plan from their tablet to the panel, pull weather from the panel to their tablet, or wirelessly updated GPS databases. It’s a smart strategy, since no other app company can match this level of integration, and it’s a compelling reason to stay in the Garmin family.
The latest step in this process is the ability to view live engine data on your iPad, a long-requested feature. This makes it easy to monitor engine performance in flight, screenshot potential problems for later review, and make smarter maintenance decisions. We flew the system recently in a Cirrus SR22, equipped with a G600 TXi glass cockpit, and came away impressed.
Setup
To get engine data to appear in the Garmin Pilot app, you first need a Garmin Engine Indication System (EIS) in the airplane. This is the suite of sensors that tracks RPM, fuel flow, cylinder head temperature (CHT), exhaust gas temperature (EGT), and other critical engine data. In our case, the EIS is part of the G600 TXi panel, but Garmin also offers standalone screens.
Secondly, you need a way to get that engine data sent wirelessly to your tablet. For that, the best option is a Flight Stream 510, a smart card that is inserted into a GTN series navigator. Connect your iPad to the Flight Stream from the Bluetooth menu in the Settings app, then open Garmin Pilot. You can verify connection status from the Connext page, or tap on the EIS menu option to view the details.
Next, be sure to enter your aircraft type by tapping on the blue text button at the bottom of the screen. This will display a list of compatible airplanes; tap on the appropriate one to set your profile. By doing this, the app will add red/yellow/green ranges to the key parameters. This makes it much easier to determine at a glance if your engine is operating normally.
In-flight monitoring
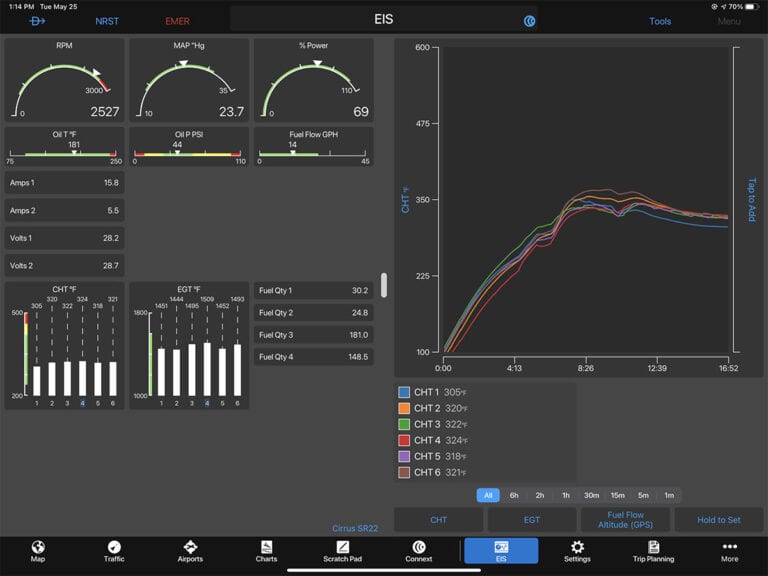
The EIS page is fairly self-explanatory: the top left shows key data like RPM, manifold pressure, and % power; oil temperature, oil pressure, and fuel flow are displayed beneath. On the left side you’ll also see small graphs for CHT and EGT, but there’s a much larger graph on the right side of the screen. This is an ideal way to track trends over time (in the example below, you can see the CHTs rise on takeoff, then level out at a reasonable level in climb.
At the bottom right corner, you can select the time period for the graph, from 1 minute to all-time. You can also tap on the other buttons to display a graph of different engine data. Here’s the view of EGT, which shows the leaning process as we went from rich to lean of peak.
You can even create your own graphs—just tap on the blue labels to the left and right side of the graph and you’ll see a menu of options. The list is impressively long, making it easy to track fuel flow vs. altitude, % power vs. airspeed, and much more.
For a detailed look, tap the bar in the middle of the screen and swipe left. This will take the graph to full screen, helpful for zooming in on any abnormalities.
Finally, don’t forget that EIS data can be viewed (like almost everything else) in a split screen view. From the Map page, tap the split screen menu button and choose EIS. We found this to be a great way to watch CHT on climb-out without taking our eye off traffic or airspace concerns.
Post-flight review
One feature that is often overlooked by Garmin Pilot users is the online companion. Go to flygarmin.com and log in with your Garmin account information. From there, you can click on Logbook to review previous flights, both manually entered and automatically recorded. In our case, this was an easy way to review the engine data from our flight and share it with our mechanic. You can play back the entire flight, complete with location, track, speed, and engine data. Use the graph below the main map area to display exactly the information you want.
The post How to view engine data in Garmin Pilot—Cirrus flight test appeared first on iPad Pilot News.
Source: Ipad appsHow to view engine data in Garmin Pilot—Cirrus flight test


